Projection Methodology
You may be familiar with linear regression, where a line is drawn through data points so that the line is as close as possible to each point. That line can then be used to understand trends in the data and to make predictions.
Our model is also a regression—specifically, a gradient boosting regression tree. Unlike linear regression, which fits a single straight line, this type of model can capture more complex, non-linear relationships in the data. It considers multiple factors at once, including age, gender, Facebook survey data, PSD employment status, and historical precinct approval rates from the 2023 school bond.
Rather than solving a single equation, the model is trained using supervised machine learning (a subset of AI). In this approach, we provide the model with real examples where both the inputs (the factors mentioned above) and the outcome (the approval rate) are known. The model then learns patterns in the data, determining how each factor contributes to the final result and how those factors interact with each other.
Training requires real-world data that is similar to the situation where the model will be applied. In our case, the February 2026 election served as ideal training data because it closely resembles the current election.
Each training example represents a single precinct. For every precinct, we calculated the input factors and paired them with that precinct’s actual approval rate. The model then learns how different combinations of factors relate to precinct approval rates.
After training, we evaluate how well the model performs. One important measure is the coefficient of determination (R²), which indicates how much of the variation in approval rates across precincts can be explained by the model. Our model has a mean R² of 0.5, meaning it accounts for roughly 50% of the overall variation between precincts.
The remaining variation reflects factors not included in the model, inherent randomness in voter behavior, and the limits of the modeling approach. Because of this, predictions tend to be moderated toward the overall average unless there is strong evidence to support a more extreme value.
Because the model is trained on data from the February 2026 election, its predictions are influenced by the patterns observed in that election. If current conditions differ, the model may not fully capture those changes. Given the complexity and variability of real-world voting behavior, an R² of 0.5 is generally considered strong and indicates that the model is capturing meaningful patterns.
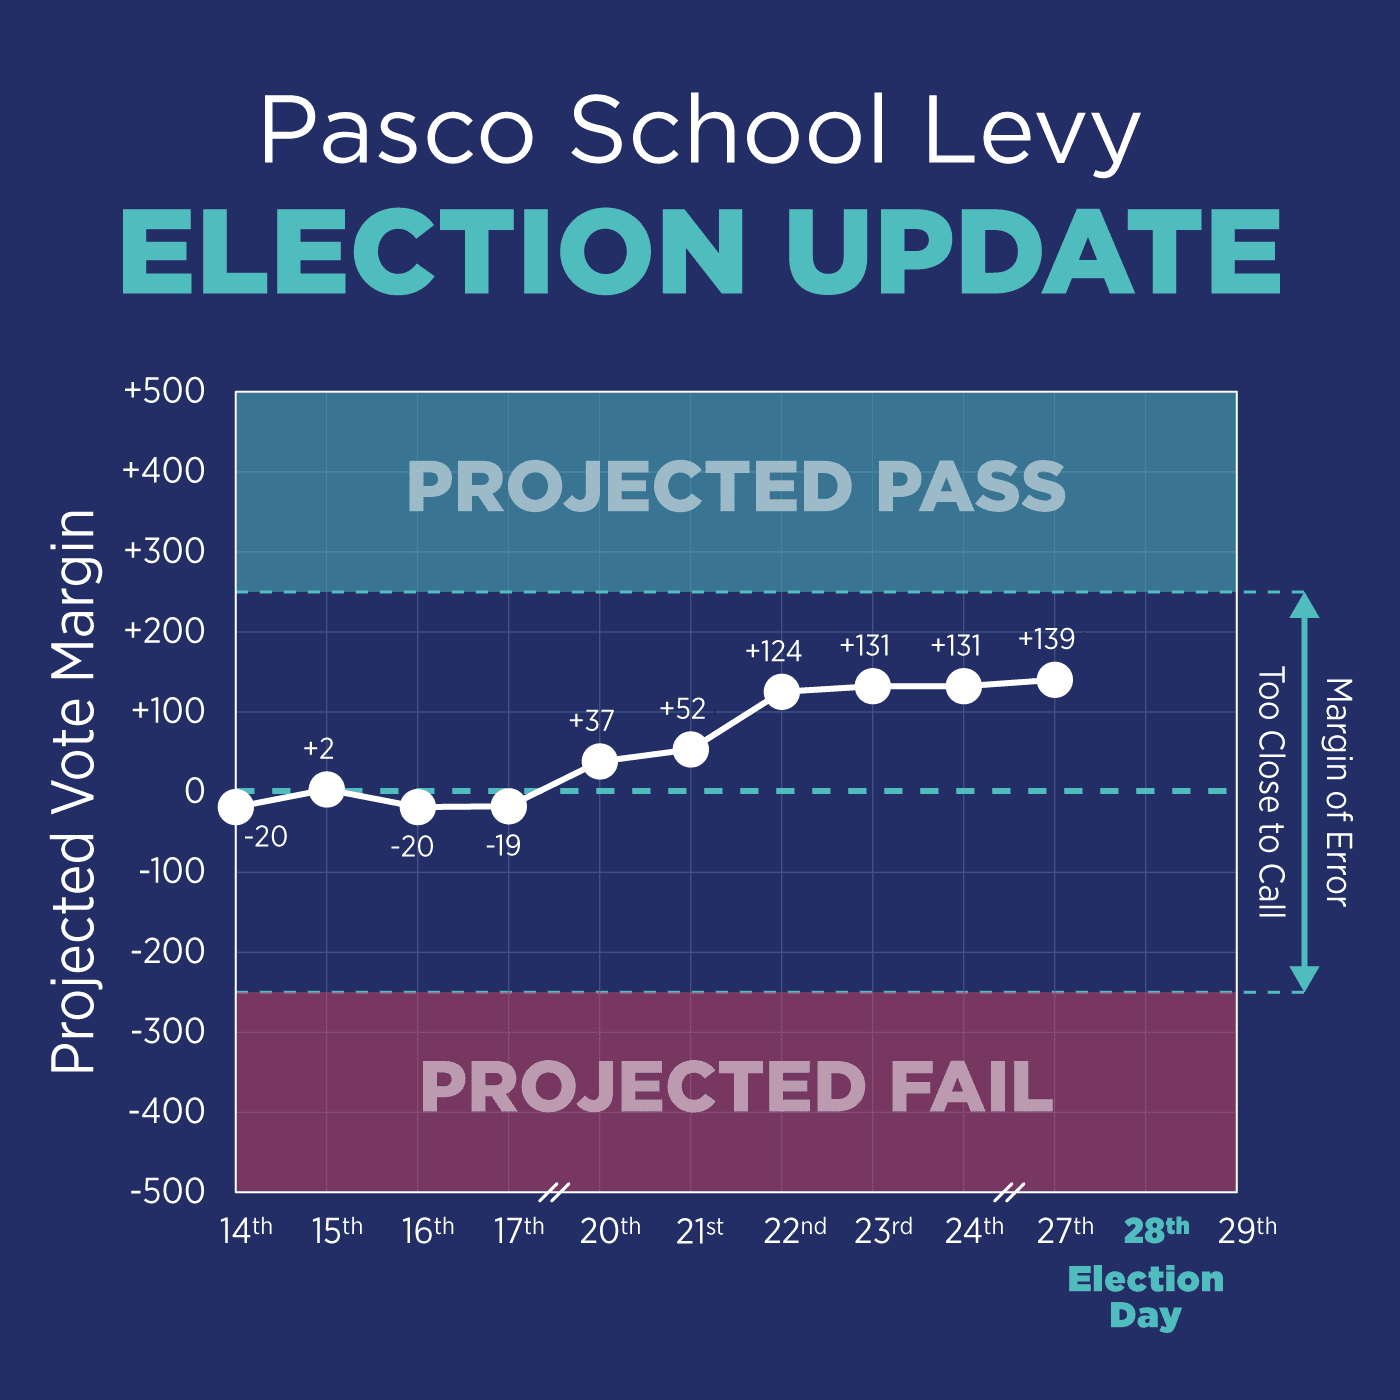
Of course, all projections involve uncertainty. Based on our model’s performance, we estimate a margin of error around ±2%, or about ±250 votes if voter turnout reaches 12,500. This represents the range in which the actual result is likely to fall, given the limits of the model and the variability of real-world behavior.